

Stage Analysis is one of the cleanest ways to stop arguing with the market. Instead of asking whether a stock is cheap, exciting, popular, or due for a bounce, it asks a better question: what stage is this stock actually in?
Stan Weinstein popularized this framework in his classic work on bull and bear markets. The idea is simple enough for a beginner to understand, but it becomes powerful when an advanced trader uses it as a full operating system: stage first, setup second, risk third.
The goal is not to predict every turn. The goal is to align your capital with the dominant phase of supply and demand, press when the odds are in your favor, and stop donating money to stocks that are already in the wrong stage.
Why stage analysis still matters
Markets change, platforms change, and the speed of information keeps accelerating. Human behavior does not change as much. Stocks still move through periods of neglect, accumulation, enthusiasm, exhaustion, and decline because institutions still need time to build and unwind meaningful positions.
Stage Analysis gives you a map for that process. It keeps your thinking anchored to the weekly chart, where the major trend is easier to see and the noise of daily candles becomes less seductive.
The stage of the stock should decide the type of trade you are allowed to take. A Stage 2 stock can be bought on strength or constructive pullbacks. A Stage 4 stock should usually be avoided by long-only traders, no matter how attractive the story sounds.
The classic filter is the long-term moving average. Weinstein originally emphasized the 30-week moving average. Many modern traders also use the 40-week moving average, which roughly tracks the 200-day moving average. The exact choice matters less than the discipline: use a consistent weekly trend filter and respect its slope.
The four stages at a glance
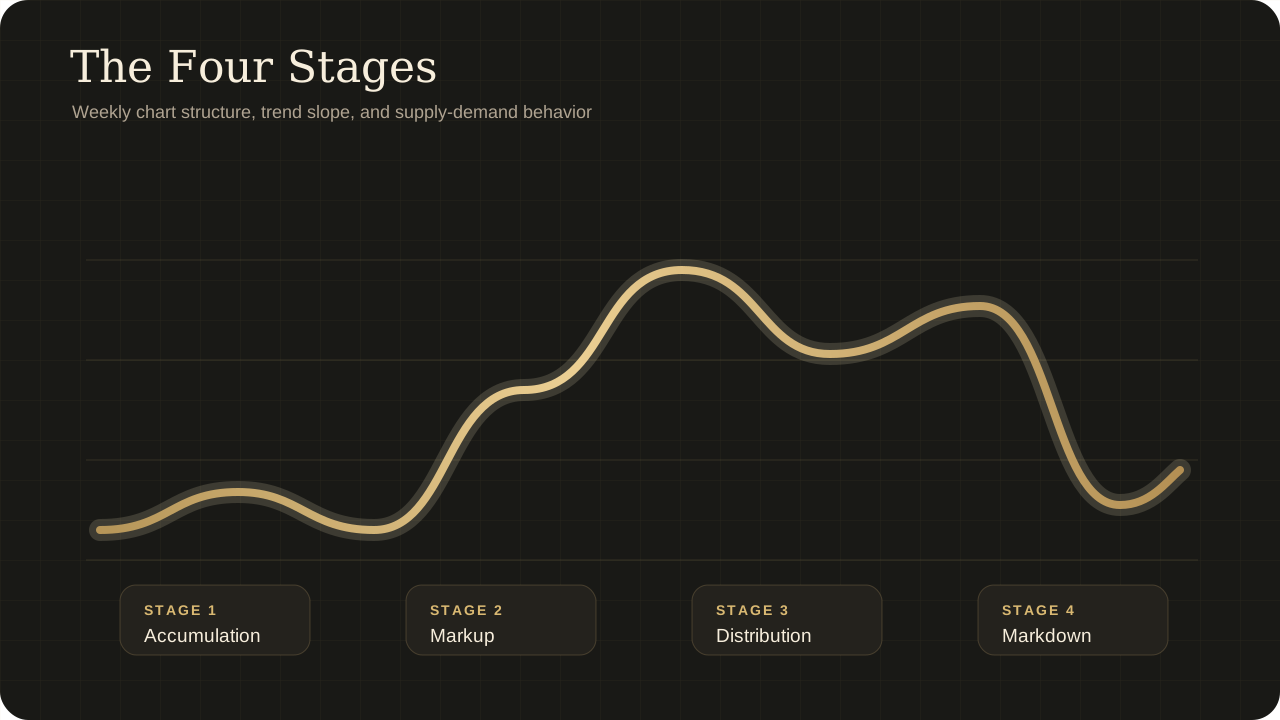
Every stock will not move perfectly through all four stages like a textbook diagram. Some bases fail, some breakouts whipsaw, and some trends go further than logic says they should. Still, most major winners and losers can be understood through this cycle.
| Stage | Market behavior | Moving average | Primary action |
|---|---|---|---|
| Stage 1: Accumulation | Sideways base after a decline | Flattening | Build watchlist, wait for proof |
| Stage 2: Markup | Breakout and sustained uptrend | Rising | Buy, hold, pyramid carefully |
| Stage 3: Distribution | Choppy topping range after an advance | Flattening or rolling over | Reduce, tighten risk, avoid fresh size |
| Stage 4: Markdown | Breakdown and persistent downtrend | Falling | Exit longs, avoid bottom-fishing |
The table looks simple. The skill is in applying it when price action is messy and your opinion is loud.
Stage 1: accumulation is a watchlist, not a victory lap
Stage 1 usually arrives after a painful decline. The stock stops making clean lower lows and begins moving sideways. The long-term moving average starts to flatten. Volume often contracts early in the base as forced selling dries up, then begins to show selective demand as stronger hands get interested.
This is where many traders make their first mistake. They see a stock stop falling and assume a new bull trend has started. It has not. A base is potential energy, not confirmation.
Useful Stage 1 clues include:
- The weekly price range tightens after a meaningful decline.
- The 30-week or 40-week moving average stops falling and begins to flatten.
- Price starts reclaiming the moving average but still lacks sustained momentum.
- Down-volume becomes less aggressive than it was during the prior decline.
- Relative strength stops deteriorating versus the broader market.
Advanced read: Late Stage 1 can be interesting, but it is still not the same as Stage 2. If you pilot a position inside a base, the size should reflect that uncertainty. The real evidence arrives when price breaks out of the base with volume and a rising trend filter.
Stage 2: markup is where the money is made
Stage 2 begins when price breaks out of its base and starts advancing above a rising long-term moving average. This is the phase where institutions are no longer quietly accumulating; demand is visible. The best stocks begin making higher highs and higher lows, pullbacks become buyable, and the weekly chart starts to look almost obvious in hindsight.
A quality Stage 2 candidate usually has several traits working together:
- Price clears a well-defined resistance level from the Stage 1 base.
- The breakout happens on meaningfully higher volume.
- The 30-week or 40-week moving average is flat-to-rising, then clearly rising.
- Relative strength is improving before or during the breakout.
- The stock belongs to a sector or industry group that is also acting well.
The advanced trader is not just asking, "Did it break out?" The better question is, "Is this breakout supported by trend, volume, relative strength, and market environment?" A breakout in a weak stock inside a weak group during a weak tape deserves less trust than the same pattern in a leading stock inside a leading group.
Stage 2 is not permission to chase anything green. It is permission to become aggressive only when price, volume, trend, and relative strength agree.
Once in a Stage 2 trend, the job shifts from prediction to management. You want to stay with the move while it remains healthy, but avoid giving back a large gain because you became emotionally attached to the story.
Stage 3: distribution is a warning, not a debate
Stage 3 is where good trades become dangerous investments. The stock has already had a significant advance. Then the personality changes. Breakouts fail faster. Pullbacks cut deeper. Volume expands on down weeks. The moving average flattens. The stock may still look strong to anyone focused on the old high, but the rhythm is no longer clean.
Distribution is difficult because it rarely announces itself with one perfect signal. It is usually a cluster of behavior:
- Repeated failure to make progress after reaching new highs.
- Wide weekly candles in both directions, showing a fight between buyers and sellers.
- Heavy-volume declines that erase multiple weeks of gains.
- A flattening 30-week or 40-week moving average.
- Relative strength rolling over before the headline price fully breaks.
The mistake in Stage 3 is treating every dip like a Stage 2 pullback. In Stage 2, pullbacks tend to refresh the trend. In Stage 3, pullbacks often reveal that supply is taking control.
Stage 3 trap: A stock can still make a marginal new high during distribution. If the new high fails quickly, arrives on weak volume, or happens while relative strength is deteriorating, it is not leadership. It is often late demand meeting institutional supply.
Stage 4: markdown is where capital goes to rest
Stage 4 starts when the stock breaks down from its Stage 3 range and begins trading below a falling long-term moving average. The pattern shifts to lower highs and lower lows. Rallies become weaker. Good news stops working. Valuation arguments become emotionally expensive.
For long-only traders, the clean rule is simple: do not own Stage 4 stocks. You do not need to short them. You do not need to predict the bottom. You simply need to stop treating a downtrend as an opportunity until the stock proves it has stopped declining and rebuilt a base.
The market will always tempt you with phrases like "oversold," "cheap," and "too far down." Stage Analysis forces the better question: where is the evidence that demand has regained control?
Until that evidence appears, cash is not laziness. Cash is discipline.
The advanced confirmation stack
Stage labels become much more useful when you combine them with a confirmation stack. The stack keeps you from making the entire decision based on one moving average crossover or one exciting candle.

| Confirmation layer | What to check | Why it matters |
|---|---|---|
| Trend filter | Price versus 30-week or 40-week moving average | Defines the primary direction |
| Slope | Moving average rising, flat, or falling | Separates healthy trends from transition zones |
| Volume | Expansion on advances, contraction on pullbacks | Shows whether demand is broadening |
| Relative strength | Stock versus benchmark such as the S&P 500 | Identifies leaders instead of laggards |
| Group strength | Sector and industry trend | Improves odds that the move has sponsorship |
| Risk location | Distance to stop and invalidation level | Prevents good analysis from becoming bad sizing |
When most layers agree, you can size and manage the trade with more confidence. When the layers conflict, reduce size or pass. A great framework is only useful if it helps you say no.
How to build a weekly stage analysis routine
The framework works best as a weekend process. Weekly charts reduce noise and make it easier to classify stocks without reacting to every intraday move.
This routine creates a decision filter before the market opens. You are not waking up each morning asking, "What should I chase today?" You already know which names are eligible and which names are off-limits.
Common mistakes that make stage analysis fail
Using daily noise to override weekly structure.
A stock can rally hard for three days and still be in Stage 4. A stock can pull back for three days and still be in Stage 2. Use the weekly chart for stage classification, then use the daily chart for execution.
Buying Stage 1 too early.
A base can keep basing for months. It can also fail and continue lower. If you buy before confirmation, you are trading potential rather than evidence.
Ignoring relative strength.
The biggest winners often start outperforming before the crowd fully notices. If a stock breaks out but still lags the market, ask why you are choosing that name instead of a true leader.
Calling every pullback distribution.
Stage 2 trends need pullbacks. The difference is quality. A normal Stage 2 pullback tends to happen on lower volume and hold logical support. Distribution is heavier, wider, and more erratic.
Holding Stage 4 because the story is good.
Stories do not protect capital. If price is below a falling long-term moving average and rallies keep failing, the market is voting against the story for now.
The limits of the framework
Stage Analysis is useful, but it is not magic. It can lag at turning points because moving averages are built from past prices. It can also produce whipsaws in trendless markets, especially when a stock repeatedly moves above and below a flattening moving average.
That is why the framework should not stand alone. Combine it with risk management, position sizing, market regime, sector strength, and a journal that tracks whether your stage labels are actually improving your trades.
Use Stage Analysis as a pre-trade filter in your journal. Record the stage at entry, the moving-average slope, relative strength condition, and whether the stock is leading or lagging its group. After 30-50 trades, review which stages are actually producing your best expectancy.
The bottom line
Stan Weinstein's Stage Analysis is powerful because it turns a messy market into a practical decision tree. Stage 1 says prepare. Stage 2 says participate. Stage 3 says protect. Stage 4 says step aside.
That discipline sounds simple, but it changes everything. You stop forcing trades in broken stocks. You stop treating every decline as a bargain. You start reserving your best capital for the stocks with the strongest evidence of demand.
The market does not reward opinions for very long. It rewards alignment with trend, demand, and risk. Stage Analysis gives you a repeatable way to find that alignment before your capital is on the line.